9 May 2014
Correcting my Tablet vs. PC Estimate
Posted by
Sameer Singh
|
9 May 2014 -- 14:30
|
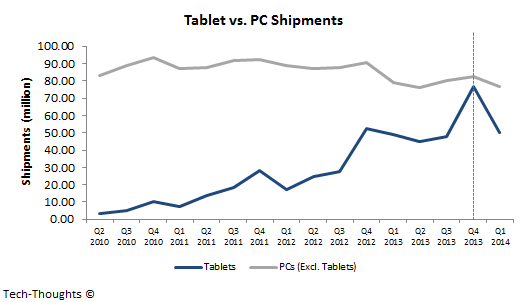
Early last year, I had estimated that tablet shipments would overtake those of PCs by Q1 2014. From the chart above, it is clear that I was wrong. The reason for this has become clearer over the past few months, i.e. the usage overlap between pocketable and tablet computing has increased rapidly while tablets have not encroached upon productivity use cases at the same pace. As a result, the "high-end" content consumption segment of the tablet industry has been partially cannibalized by large screen smartphones.
This creates an interesting dilemma. How do we measure the substitution rate between PCs and both tablets and large screen smartphones? As of now, we can assume that ~20% of all smartphones shipped have screen sizes large enough to become acceptable substitutes for tablet computing tasks. As I explained before, it is difficult to draw a line between a "phablet" and a simple smartphone from the perspective of usage patterns. Consequently, the analysis becomes a bit fuzzy but it's something we'll have to live with.
This chart seems to make a lot more sense than the one above. It is clear that Q4 2012 was the inflection point between the PC and mobile industry (at least in terms of shipments) and seems consistent with my previous analysis of the PC replacement cycle. Now our challenge is to analyze the substitution patterns between tablet and large screen smartphone purchases. That presents an even bigger challenge.


